BXPort
Context & Problem
Target Users
Crypto traders, analysts, and financial enthusiasts
Goals
- Design real-time dashboards for crypto market data
- Enable adjustable refresh intervals and user preferences
- Visualize complex trading data in an intuitive and actionable way
- Support multi-device usage for traders on the go
BXPort needed a companion web dashboard for crypto trading that could present dense real-time data with customizable refresh intervals. Existing solutions were cluttered, slow, and made it hard for users to track market trends effectively.
Process
Analyzed trader workflows and pain points through user interviews
Mapped essential data visualization needs including price, volume, and order book depth
Created wireframes optimized for high information density and real-time updates
Designed interactive charts and visual patterns for quick decision-making
Prototyped refresh interval settings and tested usability with traders
Iterated on layout and visual hierarchy to maximize clarity and reduce cognitive load
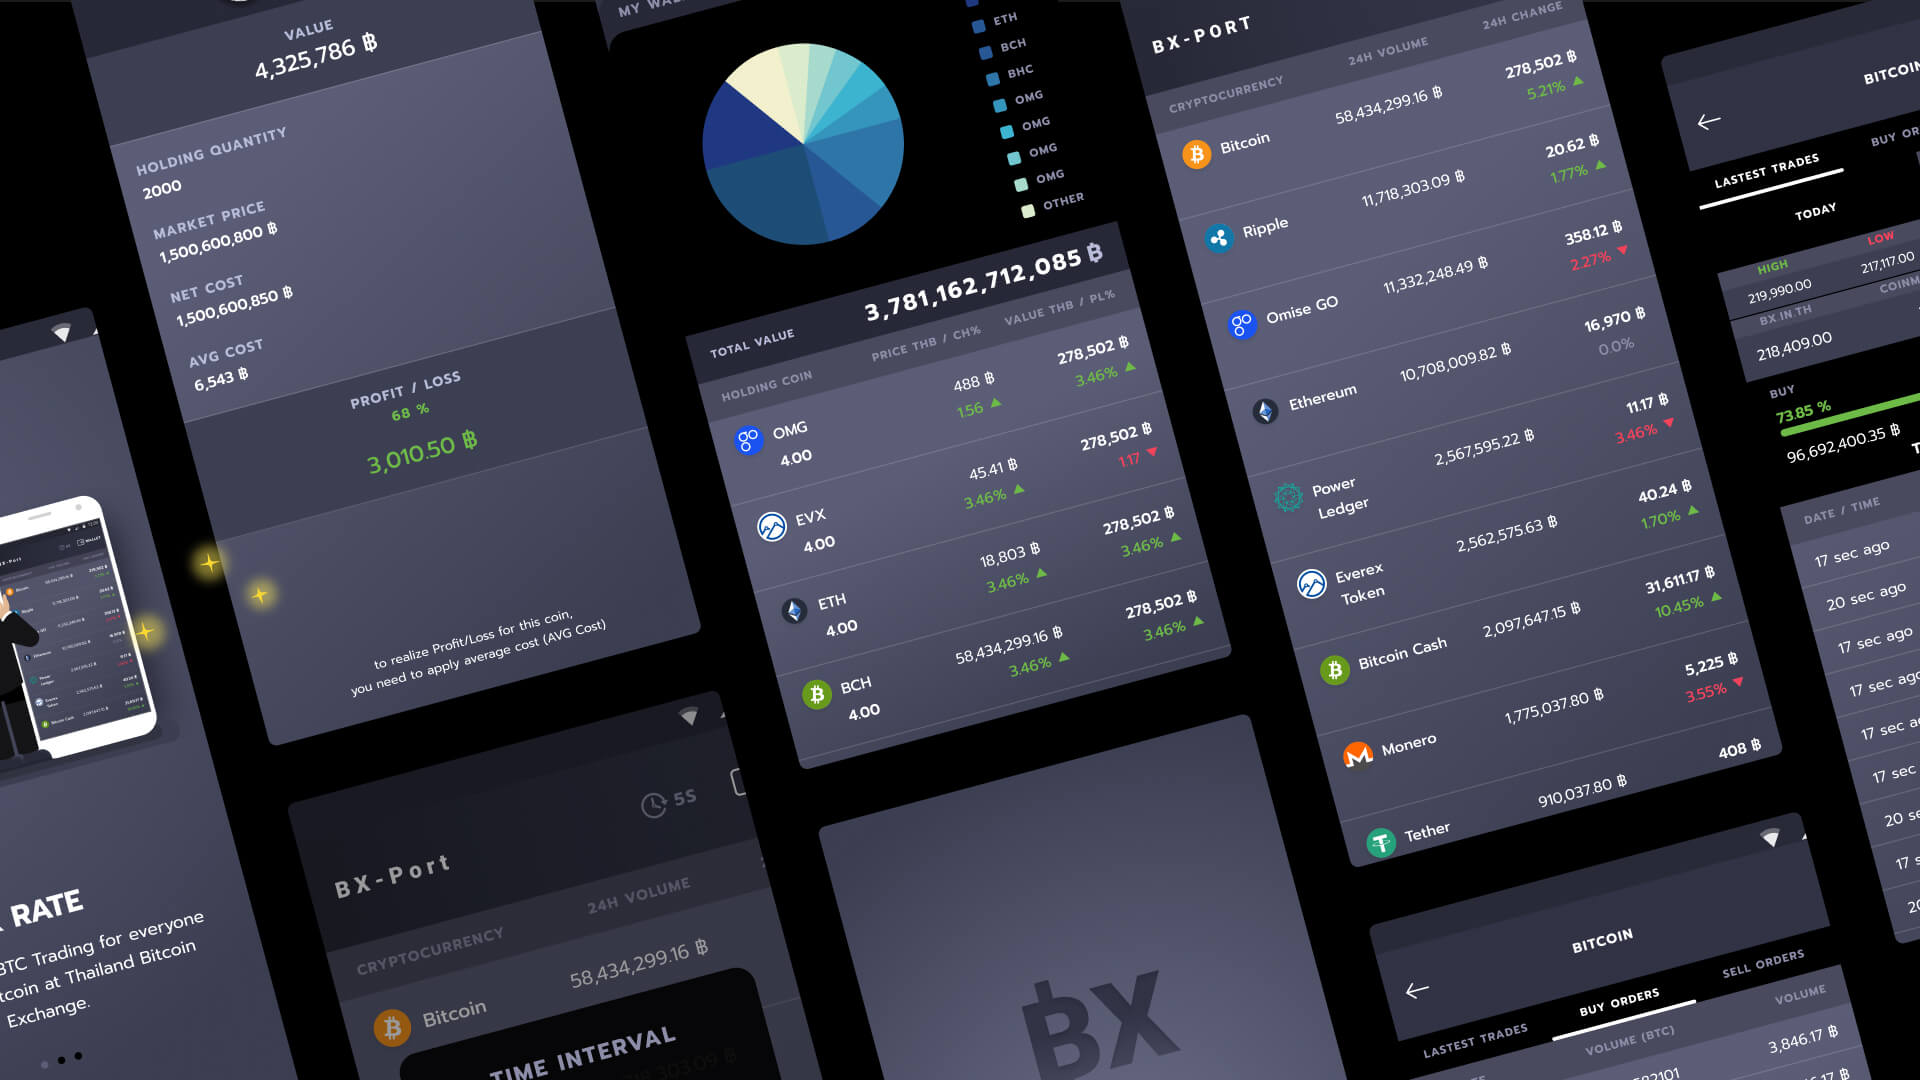
Solution Overview
BXPort delivered a high-performance trading companion platform with dense yet readable dashboards, interactive data visualizations, and customizable refresh intervals. The intuitive interface allowed traders to act quickly based on live market insights.
Outcome & Learnings
Improved data comprehension and decision-making speed for traders by 40%. Refresh interval customization reduced latency complaints by 60%. The platform became a go-to tool for crypto enthusiasts seeking deeper market visibility.